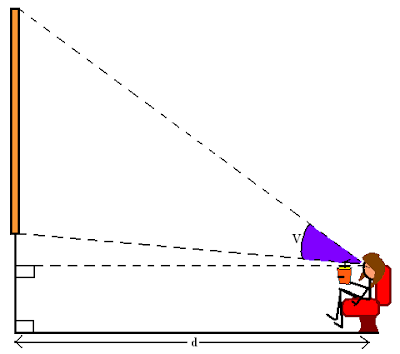
ALL of our kids go to the movies regularly. The question I will ask when they look at this picture is, "Who's the sucker? Where (in this picture) would you NOT want to sit?"
Then, hopefully they'll figure out that the ideal seat(s) would maximize the viewing angle. So, that brings us to a standard maximization trig problem. An IMAX screen is 53 feet by 73 feet. We all know that we would want to sit in the middle of the row if we can, so that isn't so interesting. What is interesting is WHICH ROW IS THE BEST?? If we now assume that, when you sit, your eyes are about 4 feet away from the ground and that the bottom of the IMAX screen is about 7 feet off the ground, you can draw a side-view diagram to help you set up an equation, in order to maximize the viewing angle, V, by adjusting horizontal distance from the screen, d.

The MOST interesting part of this, for me, is that when you set up this hypothetical problem and you then graph V as a function of d, you get a graph that looks like this, which has a domain of d feet away from screen and a range, V, of viewing angle:

Still not interesting for ya? Look carefully at this graph. The graph assumes that the viewing angle decreases as you move further away from the screen -- true in old-school movie theaters, but why isn't it true in modern theaters? What do they do differently nowadays that fixes this problem?
(The difference is obvious if you've ever been to the Egyptian Theater in Seattle's Cap Hill, or any other old-school, ma-and-pop theater. They don't have a slanted floor!! HOW CAN THEY NOT HAVE A SLANTED FLOOR?!?!)
Anyway, that was a lot of rambling, but I was excited after I had worked through all the math to discover the connection between the graph and the real-world movie experience! :)
Would this graph represent the already slanted floors of today's movie theaters or the old school unslanted ones?
ReplyDeleteThis graph represents a straight-forward scenario (level floor). The problem of tapering that you see at the right end of the graph is fixed in modern movie theaters by slanting the floors! (And hence the AHA! at the end of this problem.) :)
ReplyDeleteI really enjoyed this post, and just put together a quick Sketchpad file that might help if you end up teaching this as a lesson. (You need GSP5, though).
ReplyDeleteAlso, here's another one re: camera angles & focal lengths. Sort of a similar concept.
IMAX
www.mathalicious.com/wp-content/uploads/Sketchpad/IMAX.gsp
Focal Length Distance
www.mathalicious.com/wp-content/uploads/Sketchpad/Focal%20Length%20Distance.gsp
Awesome. Thanks! I'm working on getting GSP5... In the meanwhile I'll grab the files off of your server.
ReplyDeleteCheers!