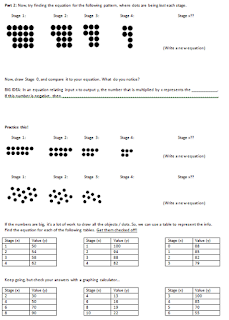
Step 1: Writing equations of positive rates, from visual dot patterns.

Step 2: Drawing patterns from equations, in order to visualize the symbols within an existing equation.

Step 3: Writing equations with negative rate patterns, and then transitioning over to tables of values.

Step 4: Working with increasingly complex patterns with fractional rates (both positive and negative).

The result? They were hungry to get through it. They were looking for more. They were totally ready for the idea of the linear rate being "what happens, over how long it takes" by the end of this packet, and were able to write simple linear equations with no problem.
Subsequently, when I put up a table of values that had (6, 10), (9, 5), (12, 0) in it, many of the kids immediately were able to come up with the equation y = x(-5/3) + 20. Nice...! (Not all of them had really finished the packet at that point, since many of them were absent previously and were therefore a bit behind on the packet. So, this is really not bad. Even the kids who were a bit behind didn't have issues understanding why the equation would be true, when we discussed it as a class.)
So, here you go -- one of my last share-worthy materials of the year.
PS. This year, I didn't have them try to circle the missing/taken away dots in the negative rate cases. I just had them think about what is the value in stage 0. For example, if the pattern is
(1, 18), (2, 14), (3, 10), then they can first tell me that in stage 0, there are 22 dots. So, the equation is going to look like y = 22 + x(...). But, since we're not adding groups of 4, we don't want to write y = 22 + x(4). I just asked them, "How do we show that we're taking away 4 dots each time?" And the kids said, "Use negative 4!!" So, there, we write y = 22 + x(-4) together on the board, and they can re-arrange it into y = -4x + 22 if they'd like. Easy breezy. Then, in future work with tables of values, I just had to ask them, "Are we adding dots or taking away dots?" and they'd know to fix their signs on the rate.
PPS. And, I always read equations such as y = x(-5) + 22 out loud as, "We're starting with 22 in stage 0, and taking away x groups of 5." I think if we can approach it this way, kids will not likely confuse rate or slope with y-intercept, because they'd be thinking constantly about the meaning of the multiplication. More and more, I think that it is the language that we use to describe math that has a great impact on student understanding.
No comments:
Post a Comment